|
Govt Crisis Info gaps This webpage is dedicated to discussing gaps in the information provided by the Government websites in crisis situations, and hopefully help improve those websites. INTRODUCTION: August 24, 2015 Update: The Air Quality values for the Okanagan areas are going so high due to the Washington fires, that many people should be concerned. However, the information from the BC Air Quality website information is still unusable. The graph below is a snapshot of the BC Air Quality website, and one can only see glimpses of what is happening, because the Air Quality values are going off the scale. The website should be fixed so that we are shown all the values. Even though we sent emails to the local Whistler MLA, Jordan Sturdy, and Minister Mark Polack in July about this issue with a reference to our webpage outlining the problem when the air quality was bad in Whistler, we can see that nothing has been done. This is now hitting close to me personally as well. Our son is close to the area bicycling back from the Rockies hauling kayaks. For an activity like that, air quality is important. Next up: email to the local MLA for the Okanagan. Interestingly, that is Premier Christy Clark. 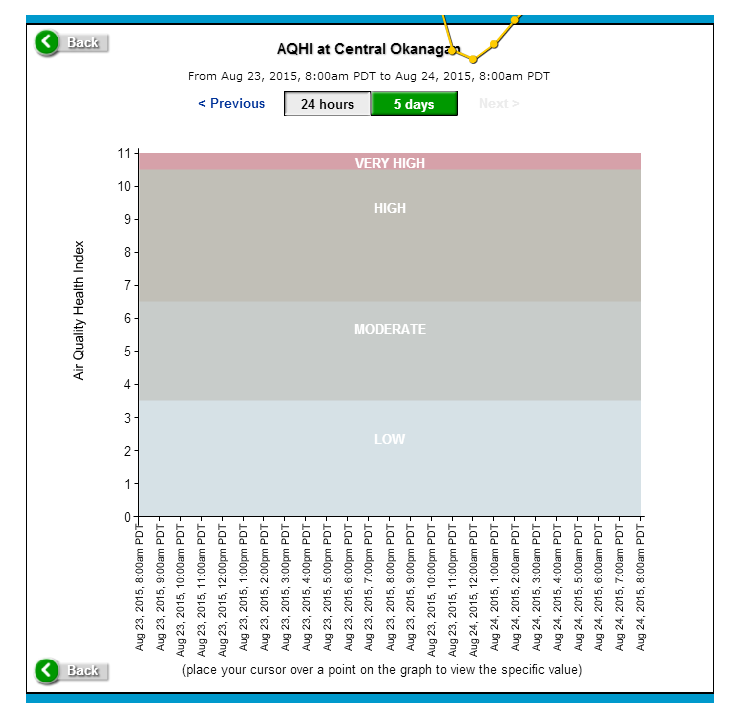
July 8, 2015: When a crisis hits, many of us rely on Government sources for giving us key information for our daily lives, and for some people their lives depend on it. As smoke filled the skies in southern BC July 6 and 7th, and threatened our health, many of us clambered to Air Quality websites to help guide us on whether to go outside, exercise outside, or even to leave the area. However, those websites have issues that, in our view, should be fixed immediately. DISCUSSION: The governments of Canada and BC both have Air Quality websites. The Government of Canada website, https://ec.gc.ca/cas-aqhi/, allows you to view the past 24 hours for a particular city. See an example for Victoria, below. 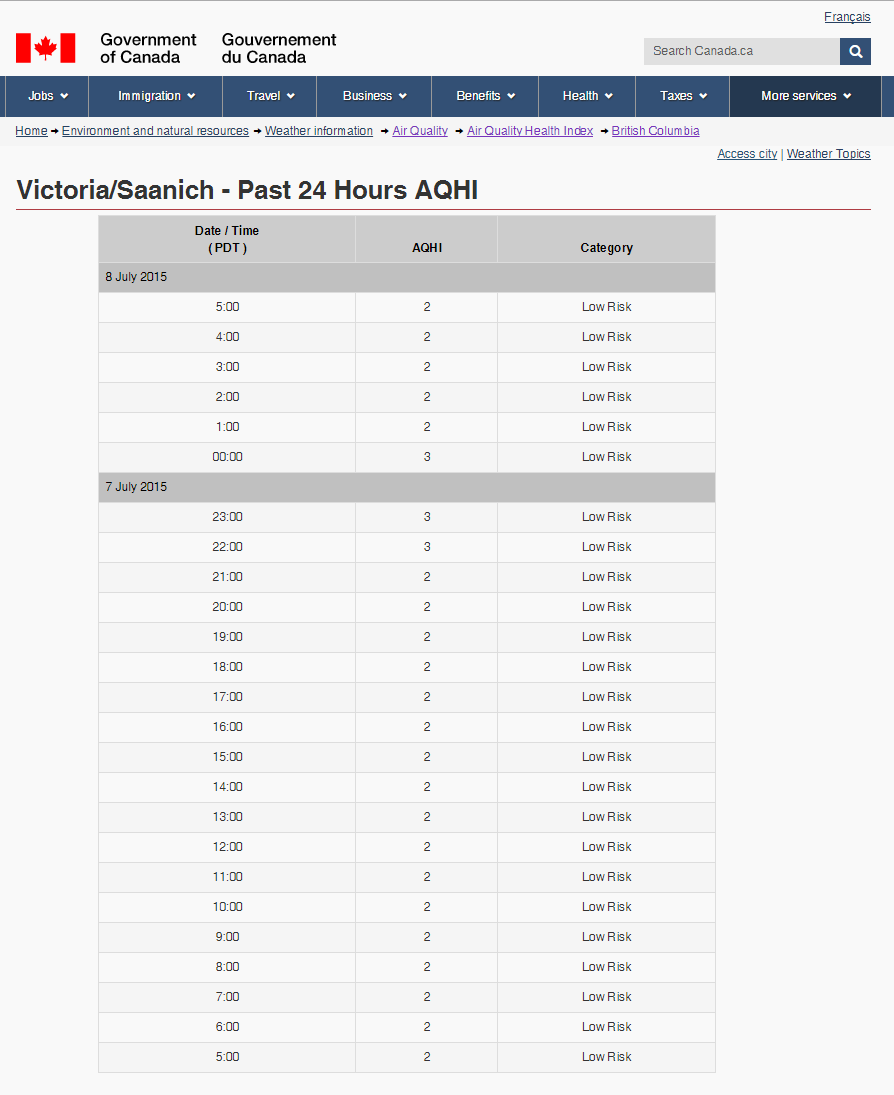
July 7, 2015; 5pm: However, when conditions get really poor it shows 10+, but does not tell us how high above 10 it is; see Whistler below. We have no idea how poor it really is. 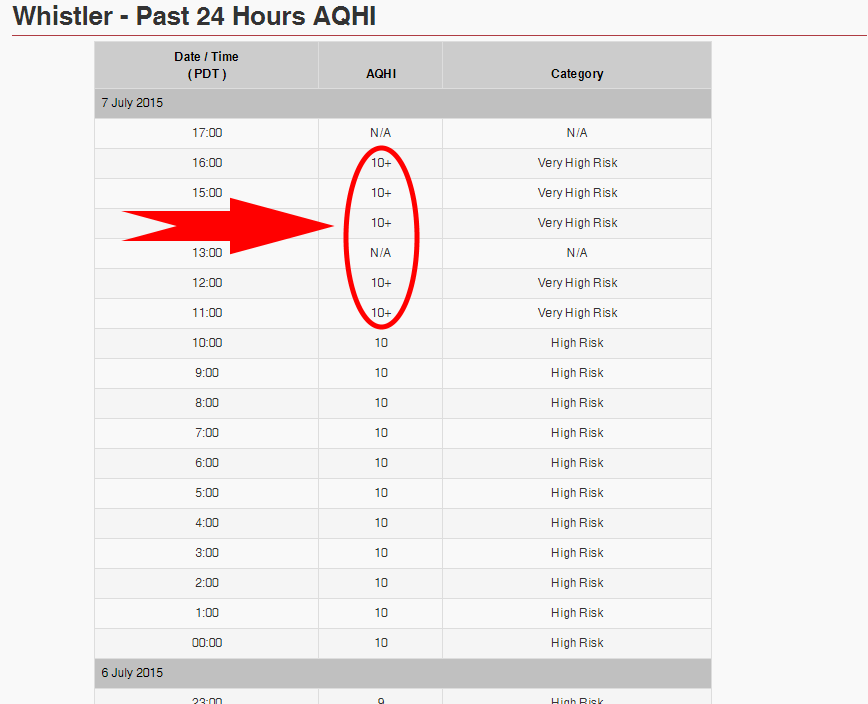
The Government of BC website, www.bcairquality.ca, also allows you to view the past 24 hours, and shows a graph for Whistler. The graph goes off the top of the page, which has some people wondering if the webpage is wrong, or if equipment is not working. Again, we have no idea how poor it really is. 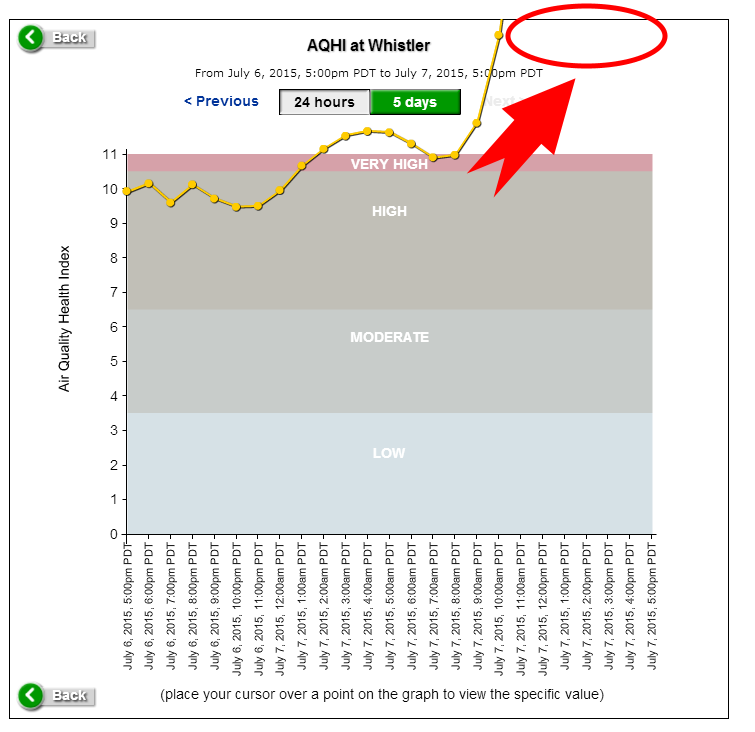
Finally, after prodding around, one can see how poor it is. You can see that the Whistler value shot up to 33!! Interestingly, it appears on the same BC Government website: http://www.bcairquality.ca/readings/index.html. Why does the value of 33 not appear on the two webpages above? 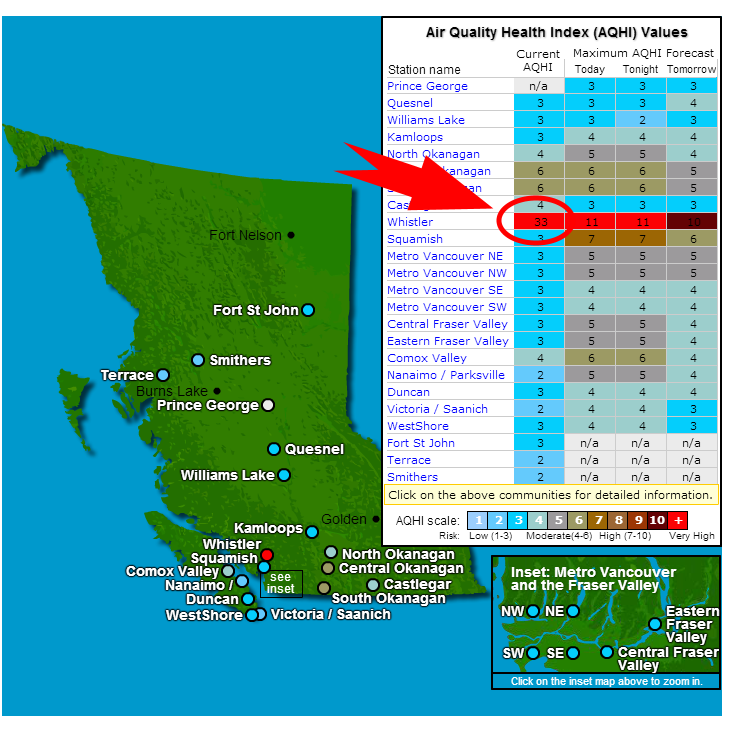
So, those people that are looking at a chart or graph for a location will not know how poor the conditions are even though the information exists. Not only that, the webpage showing advisories had no indication that Whistler had entered into extreme conditions. 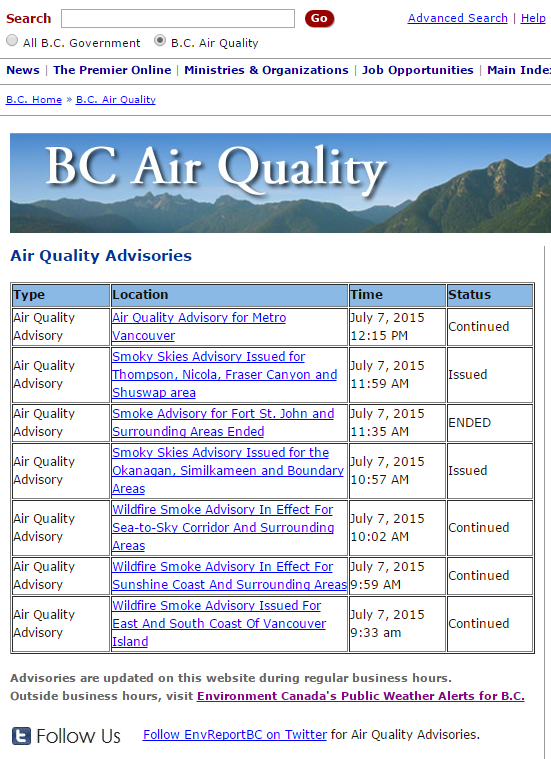
The following table shows the health risk of AQHI above 10. But, what above 20 and above 30? Shouldn't we have some comments about those values - especially since Whistler went to 33? 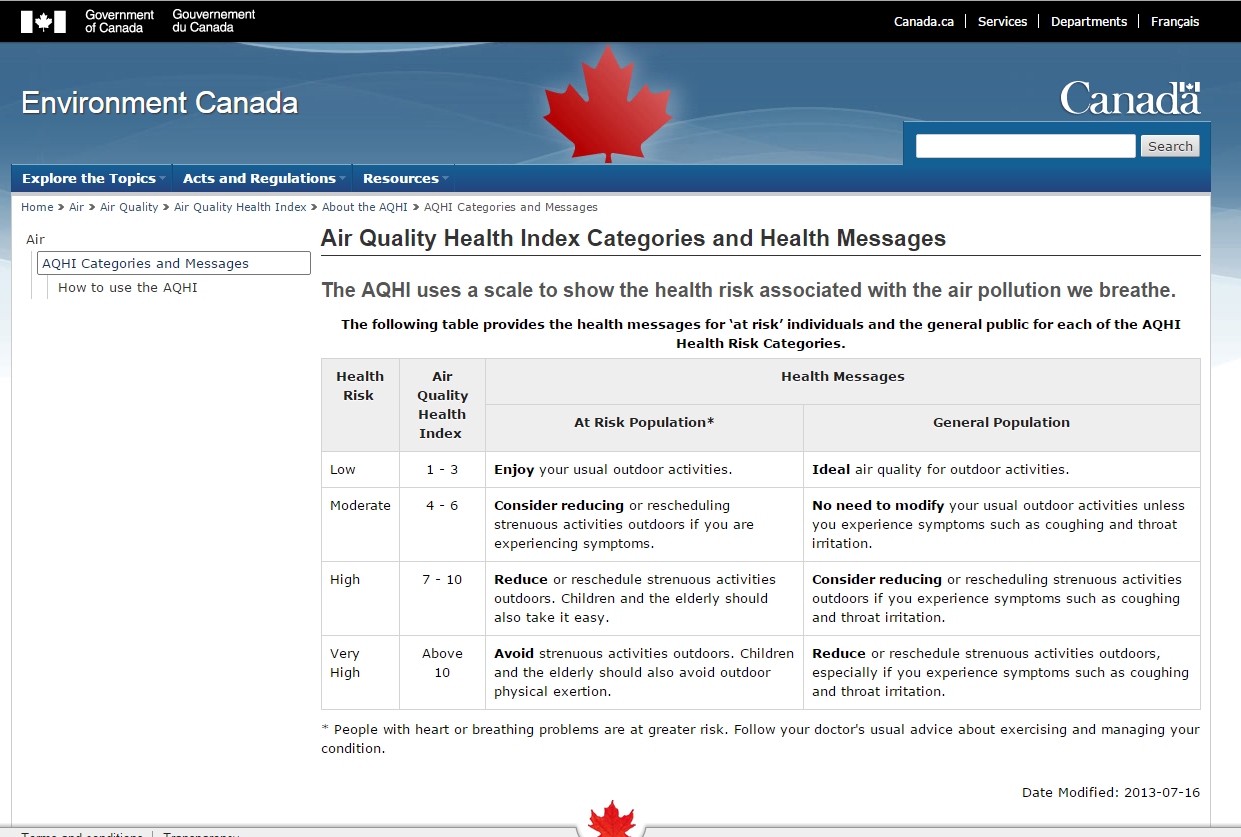
Suggestions: 1. Post the real numbers for the Government of Canada chart (e.g. 33 not 10+). 2. Adjust the graph to show the full values on the BC Government website - make sure the graphed line stays within the page. 3. When conditions get particularly severe, post new warnings immediately. 4. Update the AQHI table to show the health messages for higher values, such as 20 and 30. The next day, July 8, 2015: After the fact, you cannot see how high the values went up to. The chart and graph below were taken the next morning. There is no way to know that it went up to 33. In fact, just think of it, the only way you knew it went up to 33, was because of the screen capture at the time it happened. With the suggestions accomplished above, one would then be able to see how high the values went, after the fact. 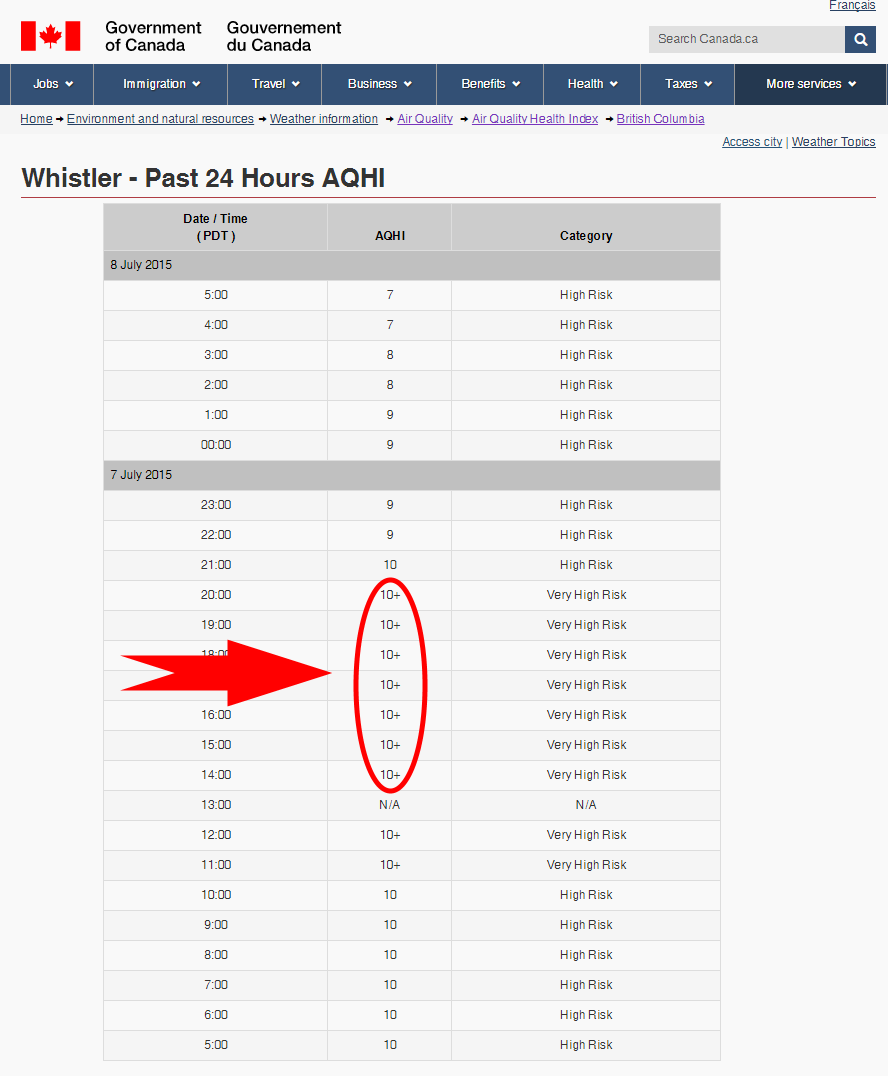
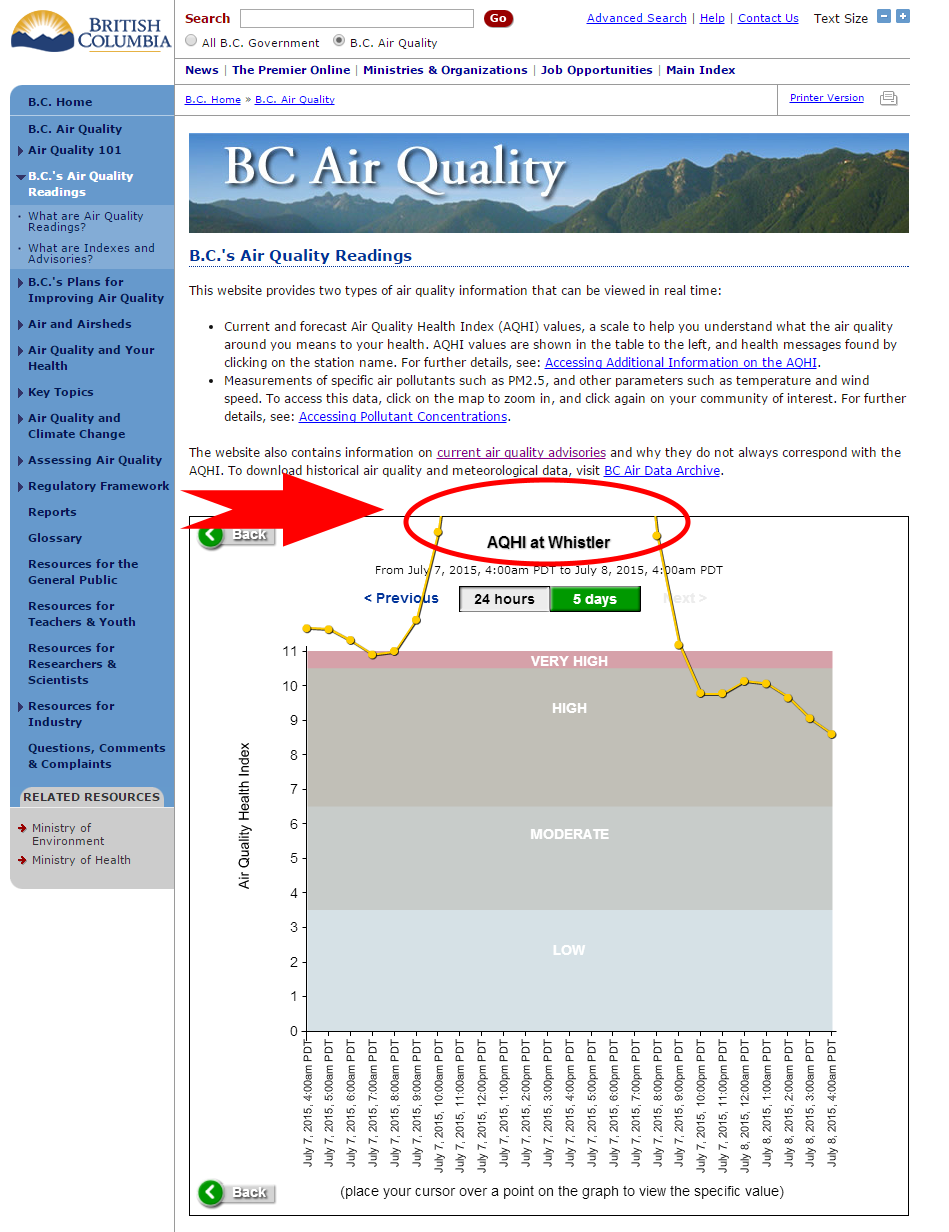
July 12, 2015; 7am: Even though we informed the BC Government about this on July 8, no action has been taken to update the webpage. The graph below shows 5 days of readings leading up to July 12, at 7am. You can clearly see the values went off the chart on July 7, but there is no way to know how high - don't we have a right to know? Also, how do we see the AHQI values after 5 days have passed? 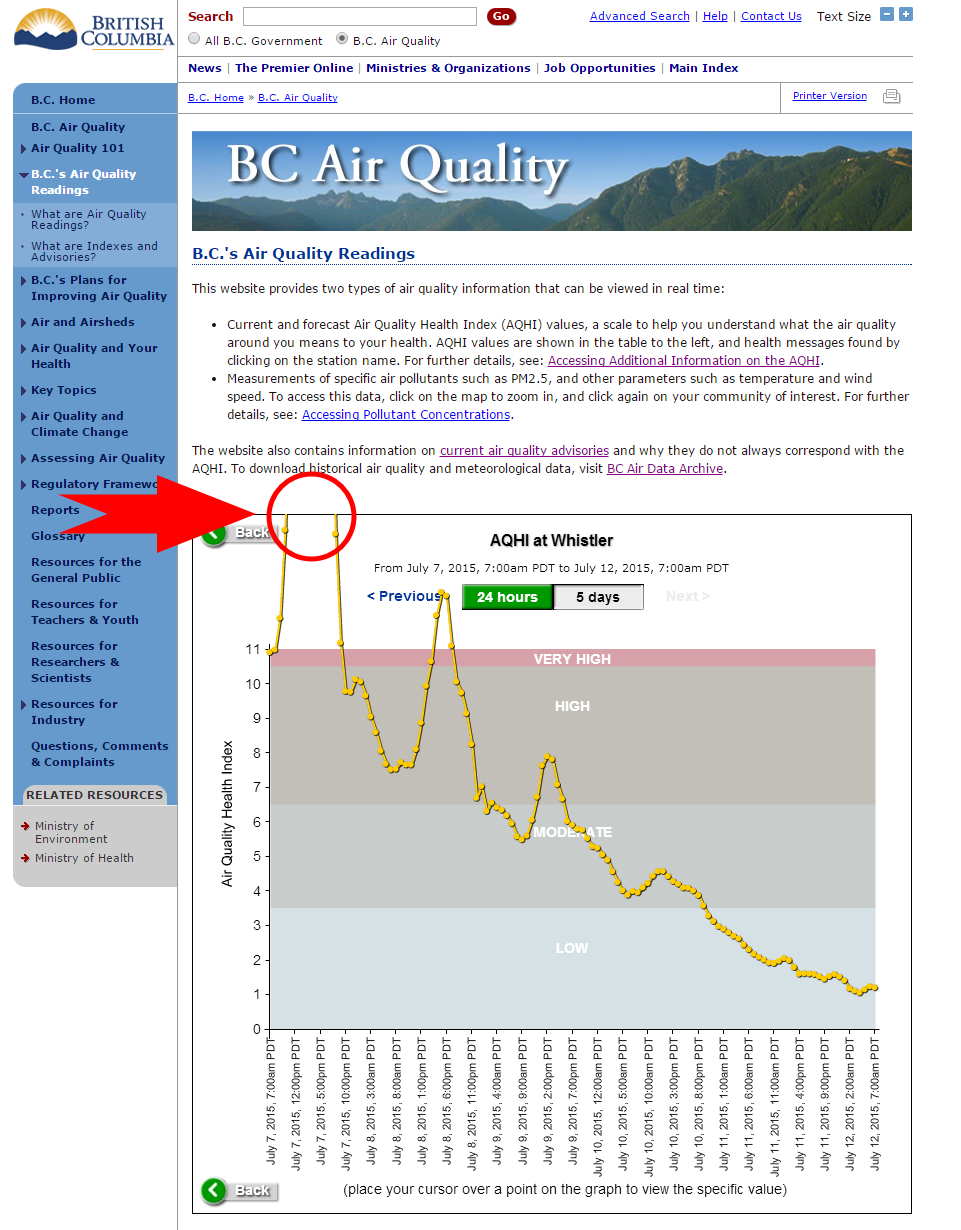
If you would like to us to post your comments regarding Air Quality, please send them to airqualitycomments@blockcommunities.com. |